Visva Amudan avatar

Visva Amudan

Product Desinger

Analytics product

Data visualisation for SaaS, B2B products

This is an analytics product built from scratch, designed to help teams visualize and track key business metrics effortlessly. I worked directly under the CTO to create a flexible dashboard where users can drag, drop, and customize charts based on their data needs. The goal was to make complex analytics simple, interactive, and accessible for both technical and non-technical users.

Industry

SaaS

Time

1-month

Date Designed

JUN 2025

analytics Product overview

Main Goals

To empower teams to visualize and understand data through a customizable, user-friendly analytics platform.

  • Build a complete analytics platform from scratch that helps users visualize and track business performance with ease.
  • Simplify complex analytics into a clean, intuitive interface for both technical and non-technical users.
  • Empower users to customize dashboards with drag-and-drop charts, filters, and real-time data insights.

Challenges Addressed

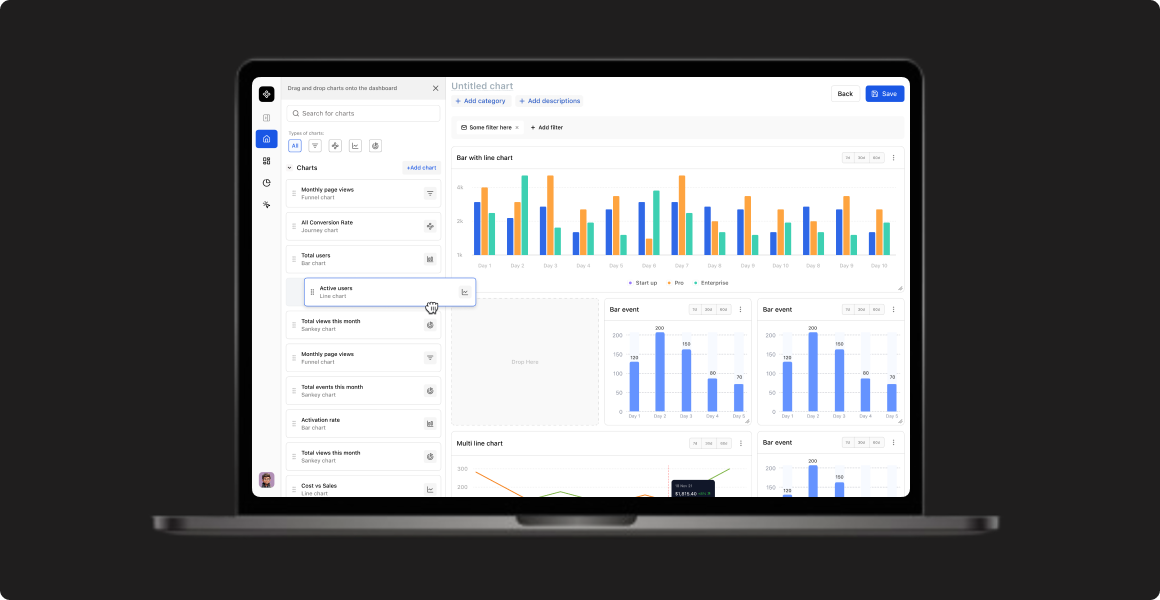
Turning complex data interactions into a seamless and intuitive analytics experience.

  • Data complexity: Translating large and varied datasets into clear, actionable visuals.
  • Usability: Designing a layout that balances flexibility (custom dashboards) with simplicity.
  • Consistency: Maintaining a cohesive design system across multiple pages and chart types.

Design Approach

A research-driven, iterative design process combining analysis, usability, and real-world feedback.

  • Built an interactive organization chart with expandable nodes for easy navigation.
  • Created a clean employee table view supporting multi-company filtering.
  • Developed a consistent design system ensuring scalability and visual balance across screens.

Overview screen

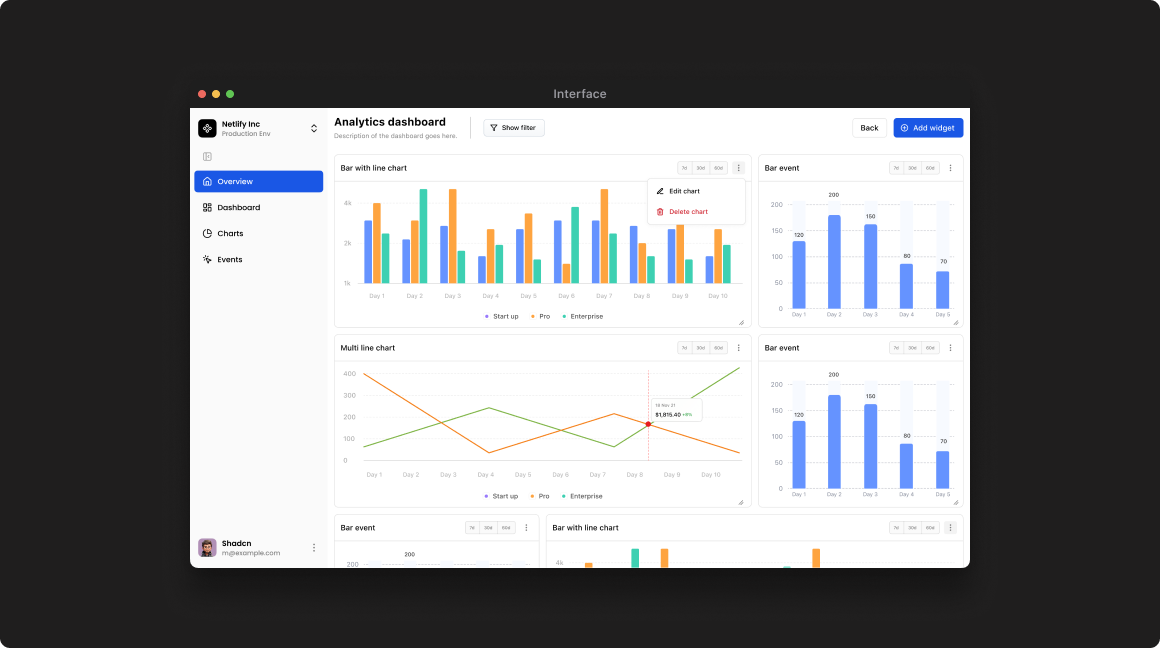
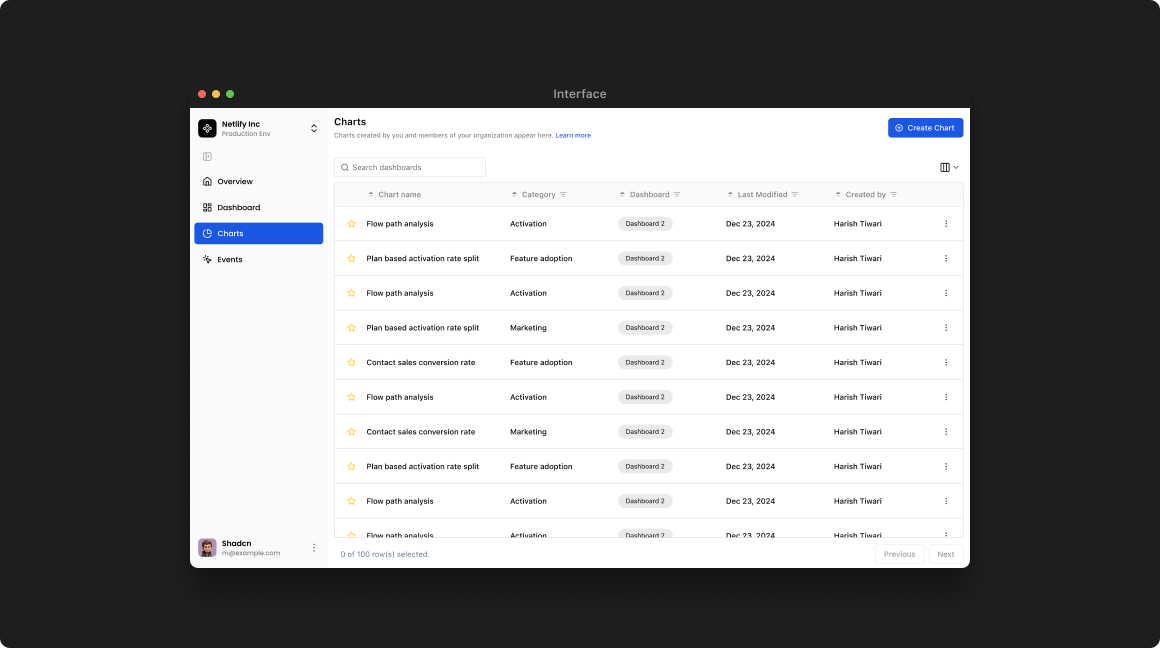
A clean, customizable dashboard that allows users to visualize key business metrics and track performance in real time.

analytics overview

Main Dashboard

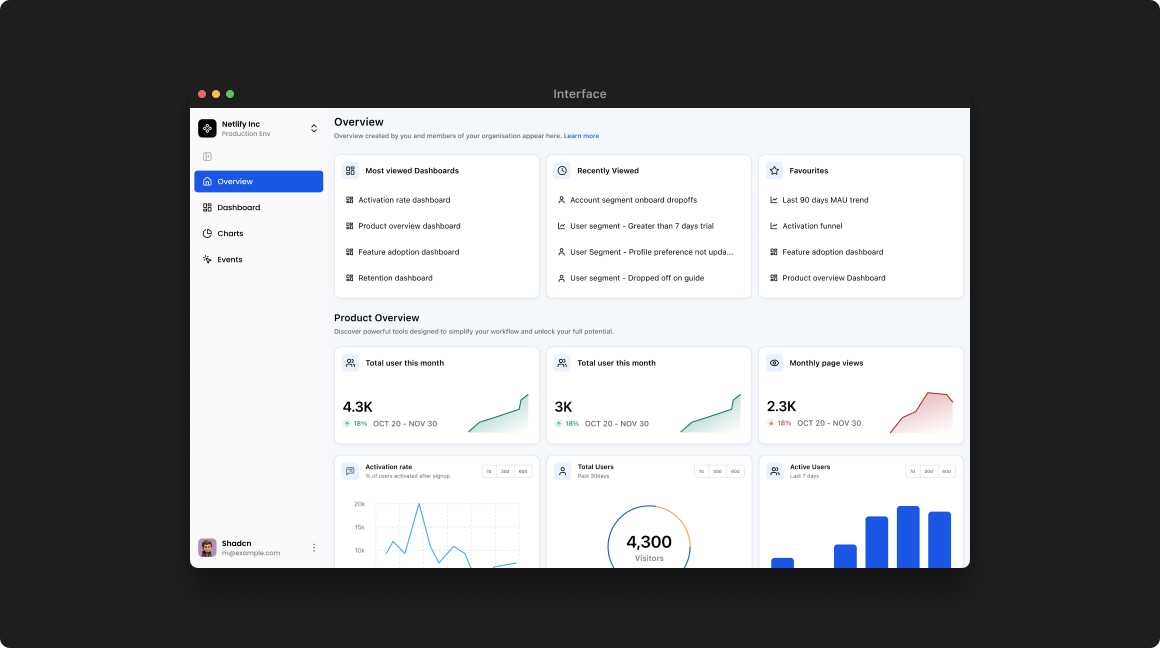
All-in dashboard designed to track key metrics, monitor user activity, visualize overall product performance in real time.

Main Dashboard

Event Verification Panel

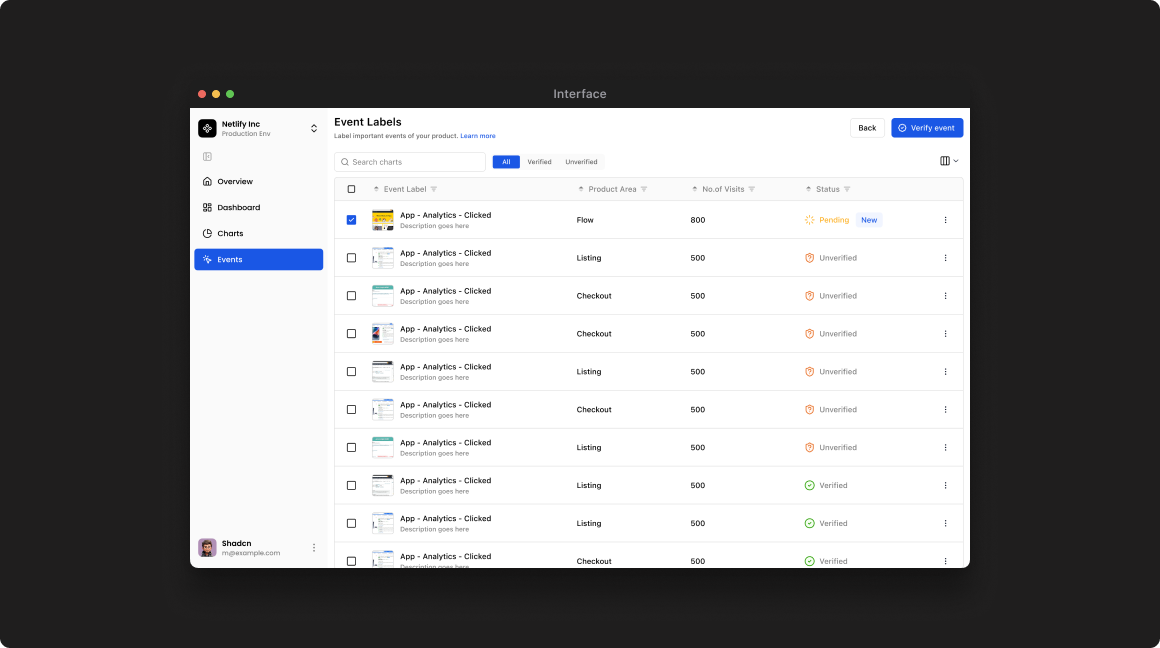
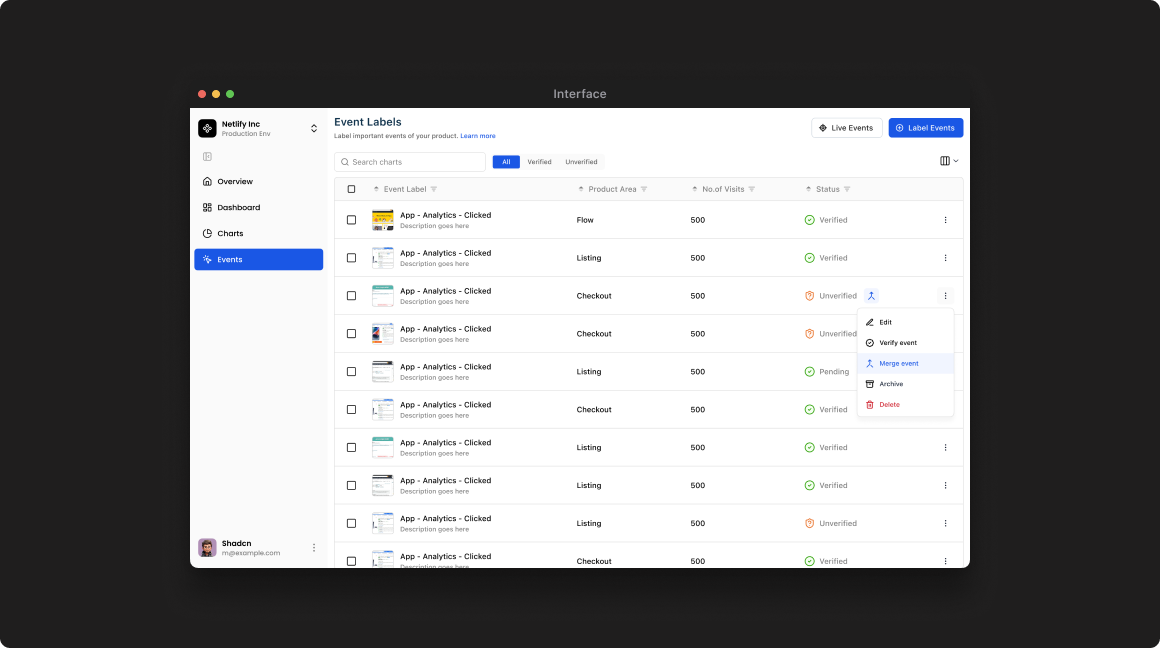
A side panel designed to help users manually verify and tag events, view occurrences, and track how each event contributes to analytics insights.

Event Verification Panel

Event table

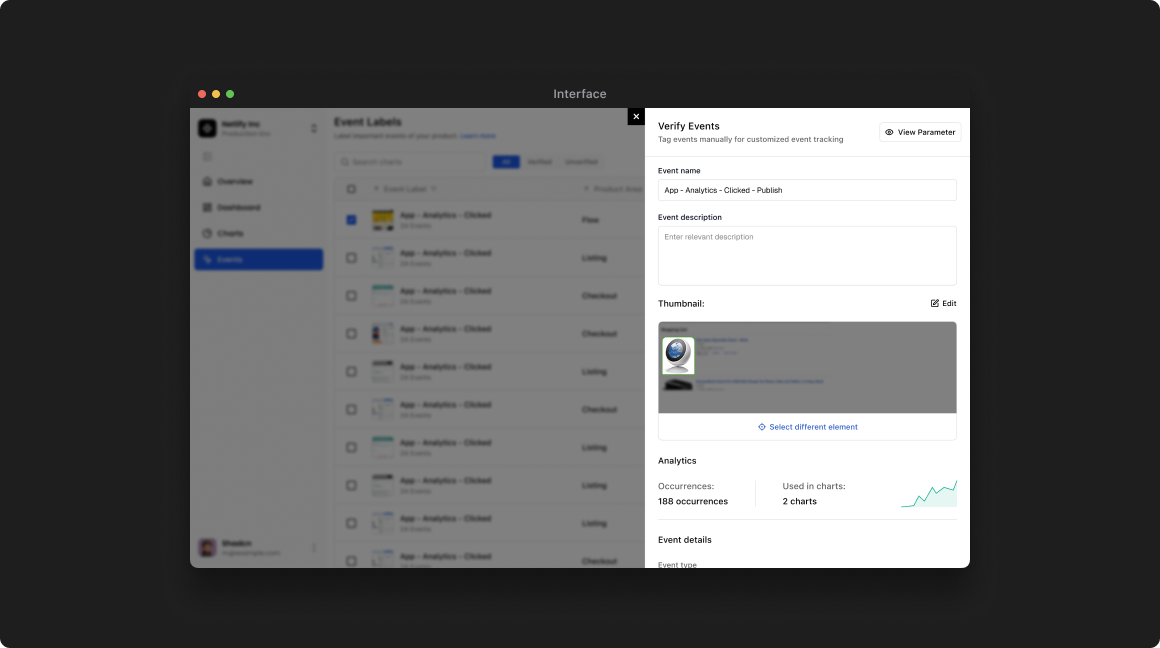
Manage, verify, and track all product interaction events in one organized view.

Event table
Delete action sub-overlay
Dark and light theme overlays

Thank you for taking the time to explore

Analytics Product